Historical data, used to generate system analytics and graphs, is backed up daily to the disk of the mBox’s internal miniPC, where we retain up to three months of key metric data.
Furthermore, this historical data is also backed up to Messana servers, preserving data starting from the system’s initial activation.
This real-time data and parameters, stored in a differential database, include:
- Temperature
- Humidity
- VOC/eCO2/CO2 levels
- Operating Modes
- On/off status
- Valve opening percentages
- Air speed/CFM
Depending on their subscription, end-users may access historical data for analysis and optimization of system performance.
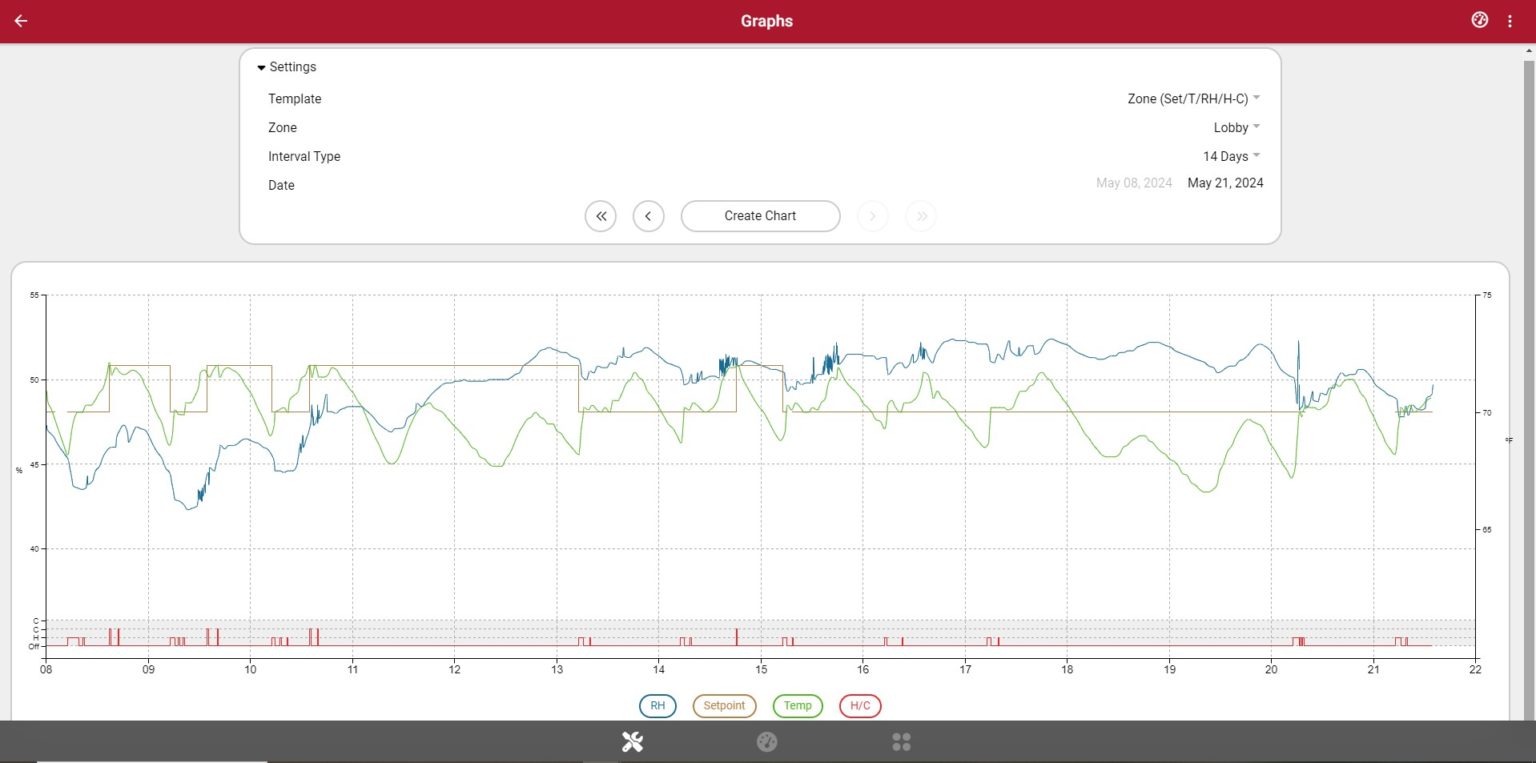
Example Graph:
Users may use one of the various templates available to generate a graph of key metrics.
Simply select your desired data for a given zone, and the time interval for your dataset.
The graph below shows the Relative Humidity, Setpoint, Temperature, and H/C mode template: